How To Use WordPress Heatmap Plugins To Optimize Your Website
There will come a time when you feel like nothing is working for your website. No matter how much traffic you bring sales and revenue numbers stay the same. But, that doesn’t mean you should give up on your website and your business.
Setting up the website, adding great content, and generating traffic is only the first few steps to getting your website up and running. The key to making it successful is continuous improvement.
You must use web analytics and do further tests to figure out what your audience wants and how to get them to click on that “buy” button. This process involves doing tests like A/B split testing and heatmaps.
Heatmaps are great for analyzing the user experience of your website and finding the hotspots of your website layout. In this guide, we explain how heat maps work and how to run a heatmap test on your own WordPress website.
What Is a Website Heatmap?
A website heatmap is a visualization of data gathered from your website using heatmap software. Or, in other words, it’s a way to track visitor behavior and visualize it using colors.

It’s like tracking someone using their footprints to see where they went and determine what they did. Heatmaps work the same way to help you understand how visitors interact with your website, how they read your articles, which buttons they click on, and which areas get the most attention.
Heatmaps can be setup on your website using specific software or a WordPress plugin. Your website visitors will never see the heatmap chart. It’s only visible to you. There are some software that even allows you to record user sessions in video format.
Why Use Them?
Even though the use of heatmaps sounds complicated, it’s not something that only marketers use. Even if you have a blog or trying to optimize a landing page, you can use heatmaps to further improve your website.
- Boost Conversions: The correct positioning of your call to actions (CTA) and the buttons is important to get more click-throughs. With heatmaps, you can figure out where to place your CTAs to get more clicks.
- Generate More Ad Revenue: Heatmaps is also useful to find the best spots for placing your ads to get more people to see them as well as to generate clicks.
- Create More Engaging Content: How do people browse your content? Do they skim the articles? Do they click on the links inside paragraphs? Heatmaps will help you figure these out to create more effective blog post content.
- Optimize Website Design: Heatmaps can be used to redesign websites. By figuring out the most active sections of your website, you can rearrange your website design and content to get the most attention from your visitors.
5 Best WordPress Heatmap Plugins
Usually, you have to install scripts and edit code to setup a heatmap system on a website. But, thanks to WordPress, you can use a simple plugin to easily setup heatmaps.
These are some of the best plugins you can use to install heatmaps on your website.
Hotjar

- Price: Free
Hotjar is a popular analytics platform that covers all aspects of marketing analytics and optimizations. It includes several different kinds of systems for analyzing your websites like heatmaps, visitor recordings, and form analysis.
Hotjar also comes with a WordPress plugin for integrating the service with your website. And offers a generous free plan for testing up to 2,000 page views per day.
CrazyEgg

- Price: $24 per month
CrazyEgg is another reputable platform that offers many different types of analytics and testing services, including heatmaps. The biggest difference between CrazyEgg and other heatmap platforms is how easy it is to use the software.
However, CrazyEgg doesn’t offer a free plan. You need a $24 per month free plan to run heatmap tests on your website. Or you can test drive using a free trial.
Aurora Heatmap
- Price: Free
Aurora is one of the best free alternatives to Hotjar and CrazyEgg. Unlike other services, Aurora doesn’t require any accounts or paid plans to use heatmaps. It’s free to use without any limitations!
Aurora Heatmaps plugin is also very easy to use and doesn’t even have a setup process. It offers lots of options for you to analyze user behavior using clicks on your website. For more advanced features, you can switch to the Pro version.
Clicky by Yoast

- Price: Free
Clicky is not exactly a heatmap plugin. Instead of offering a graphic map of hotspots on your website, Clicky uses links to help you track users and find the best spots for placing links.
Clicky automatically adds tracking codes to your links to help you analyze which links get most clicks and even assign goals to track revenue generated by each post.
UserTrack
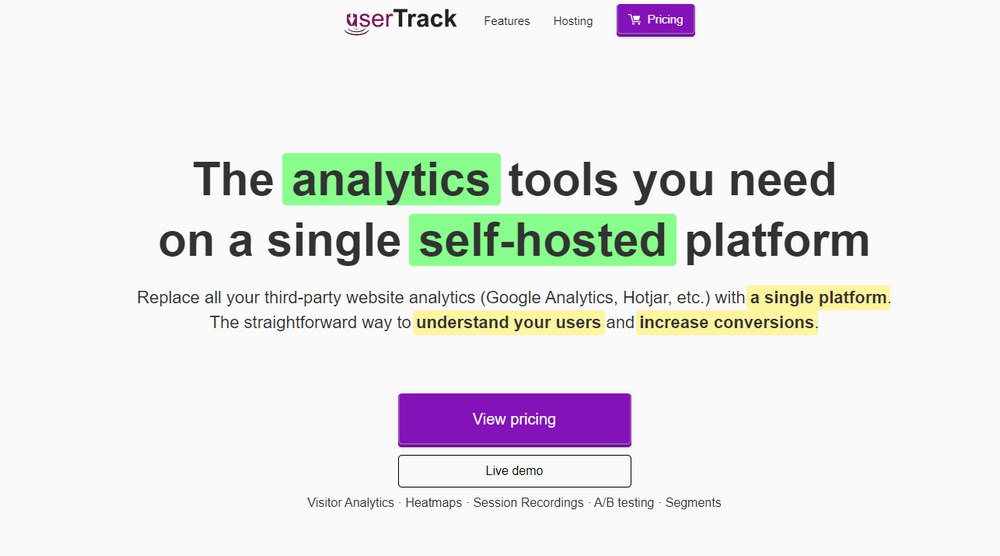
- Price: $99
UserTrack is an all-in-one premium solution for setting up a complete marketing analytics system for your website. It includes everything from website analytics to heatmaps, segmentation, session recording, and much more.
UserTrack also has a WordPress plugin for easy integration. And it only costs a one-time price of $99 to track unlimited websites using a single dashboard.
How To Install Heatmaps in WordPress
To show you how to install and setup heatmaps in WordPress, we’re using the Aurora Heatmap plugin. Mainly because it’s free without any limitations. But you can follow the process to setup any other heatmap plugin in WordPress.
Before getting started, make sure that your website is live and generating traffic. There’s no point installing heatmaps on a dormant website.
Step 1: Install Aurora Heatmap Plugin
Login to your WordPress dashboard.

Then go to Plugins >> Add New. Search for the Aurora Heatmap plugin and install it.
Step 2: Start Gathering Data
Usually, after installing a Heatmap plugin, you need to create an account with the service. And integrate the plugin with the platform using an API code. Aurora Heatmap plugin doesn’t require any of that.
As soon as you install the plugin, it will start gathering data automatically. It will take a short while before you can view the reports and start analyzing the data. It could be a few hours or a couple of days.
Step 3: Analyze the Heatmaps
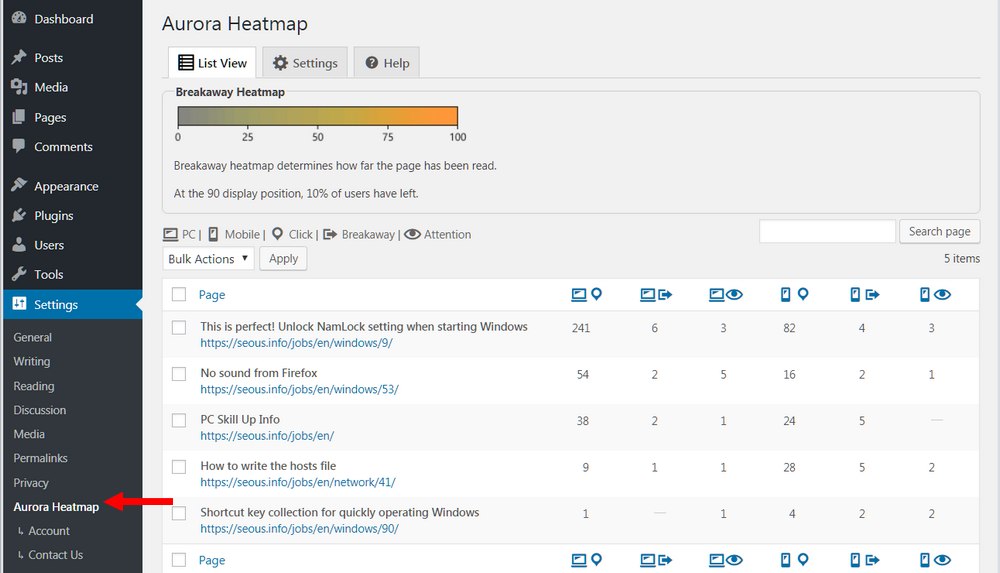
After Aurora Heatmap has gathered enough data, you can go over to Settings >> Aurora Heatmap page to view the heatmaps.
Here you can view the heatmaps for clicks and views categorized into both desktop and mobile visitors. It will show you where the visitors have clicked on the most on your website.
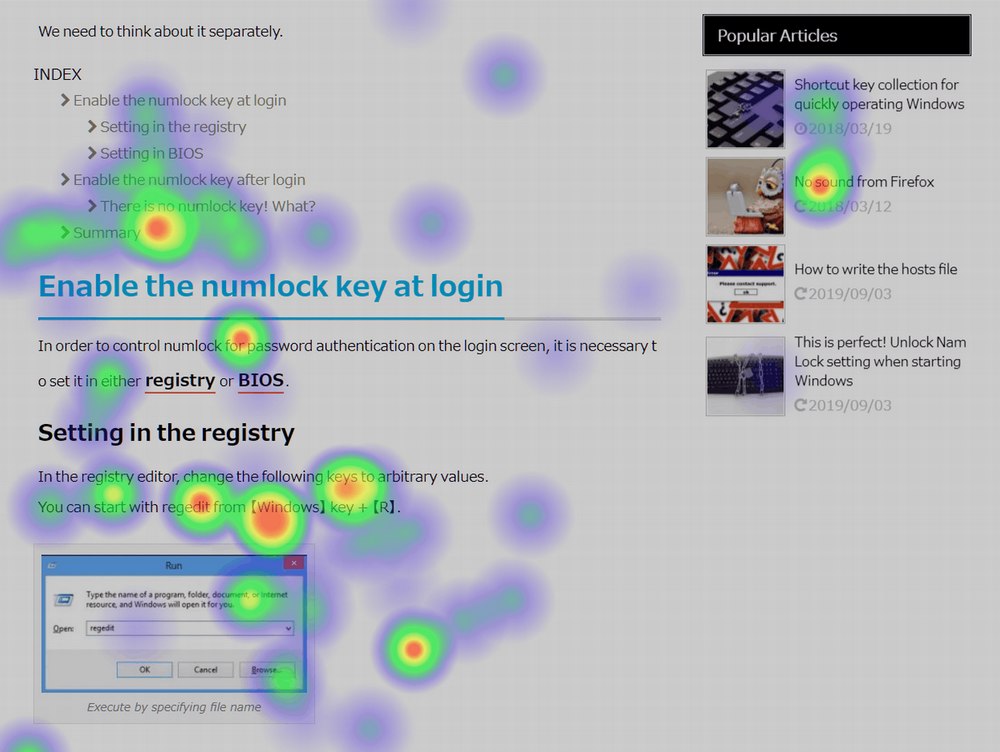
Click on a report for a specific page to view the visual heatmap.
Step 4: Optimize Your Website
Keep the heatmap plugin running for at least 14 days or 30 days if you have a fairly new website. Once you’ve gathered enough data, analyze them to find the strengths and weaknesses of your website.
Figure out which areas get the most attention and which spaces go unnoticed. Then get to work and rearrange the layout of your website. Once the changes are made, run another heatmap test to see how well the website performs.
In Conclusion
Heat maps offer great insight into your website design and how users behave on your website. You can use this data to revamp and refresh your website to generate more revenue.
But, don’t stop there. You can also try using A/B split testing tools, reducing the bounce rate, optimizing your website for speed, or even replacing the old theme with a new premium WordPress theme to try and boost your website’s success rate.
Looking for WordPress hosting? We use Kinsta. They offer world-class WordPress hosting, built to keep your website fast, secure, and always online.